Assignment #2 (Due: 9/26)
1. Read the "Graphical Integrity" chapter in E. R. Tufte, "The Visual Display of Quantitative Information" (see oncourse).
2. Read "Misleading graph" in Wikipedia.
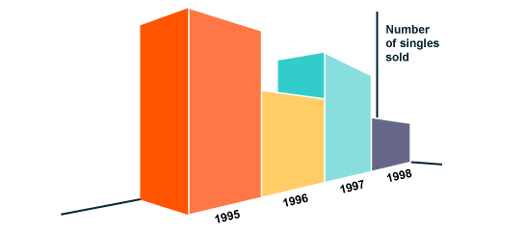
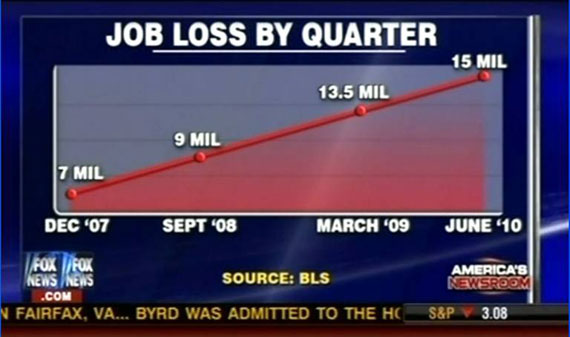
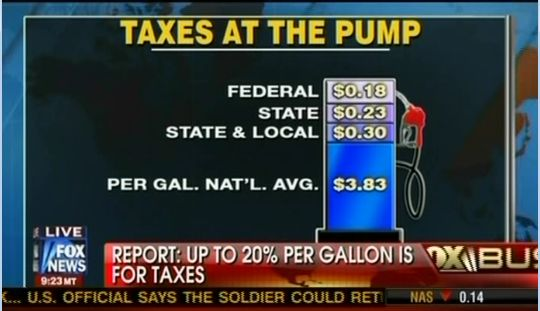
3. The following charts are examples of misleading charts. For each chart, (1) discuss why they are misleading, (2) discuss how you can fix it, and (3) draw a fixed chart (you can use excel or any other tools and the data doesn't need to be exact for the case of (A)).
| Number | Chart | Source (will be added later) |
|---|---|---|
| (A) |  |
|
| (B) |  |
|
| (C) |  |
|
| (D) |  |
|
| (E) |  |
|
| (F) |  |